
Causal Diagram Planning Studio
The StatsWithR Causal Diagram Planning Studio is a browser-based visual planning application for researchers, statisticians, epidemiologists, data scientists, clinicians, students, and other professionals who use directed acyclic graphs to communicate assumed causal structures.
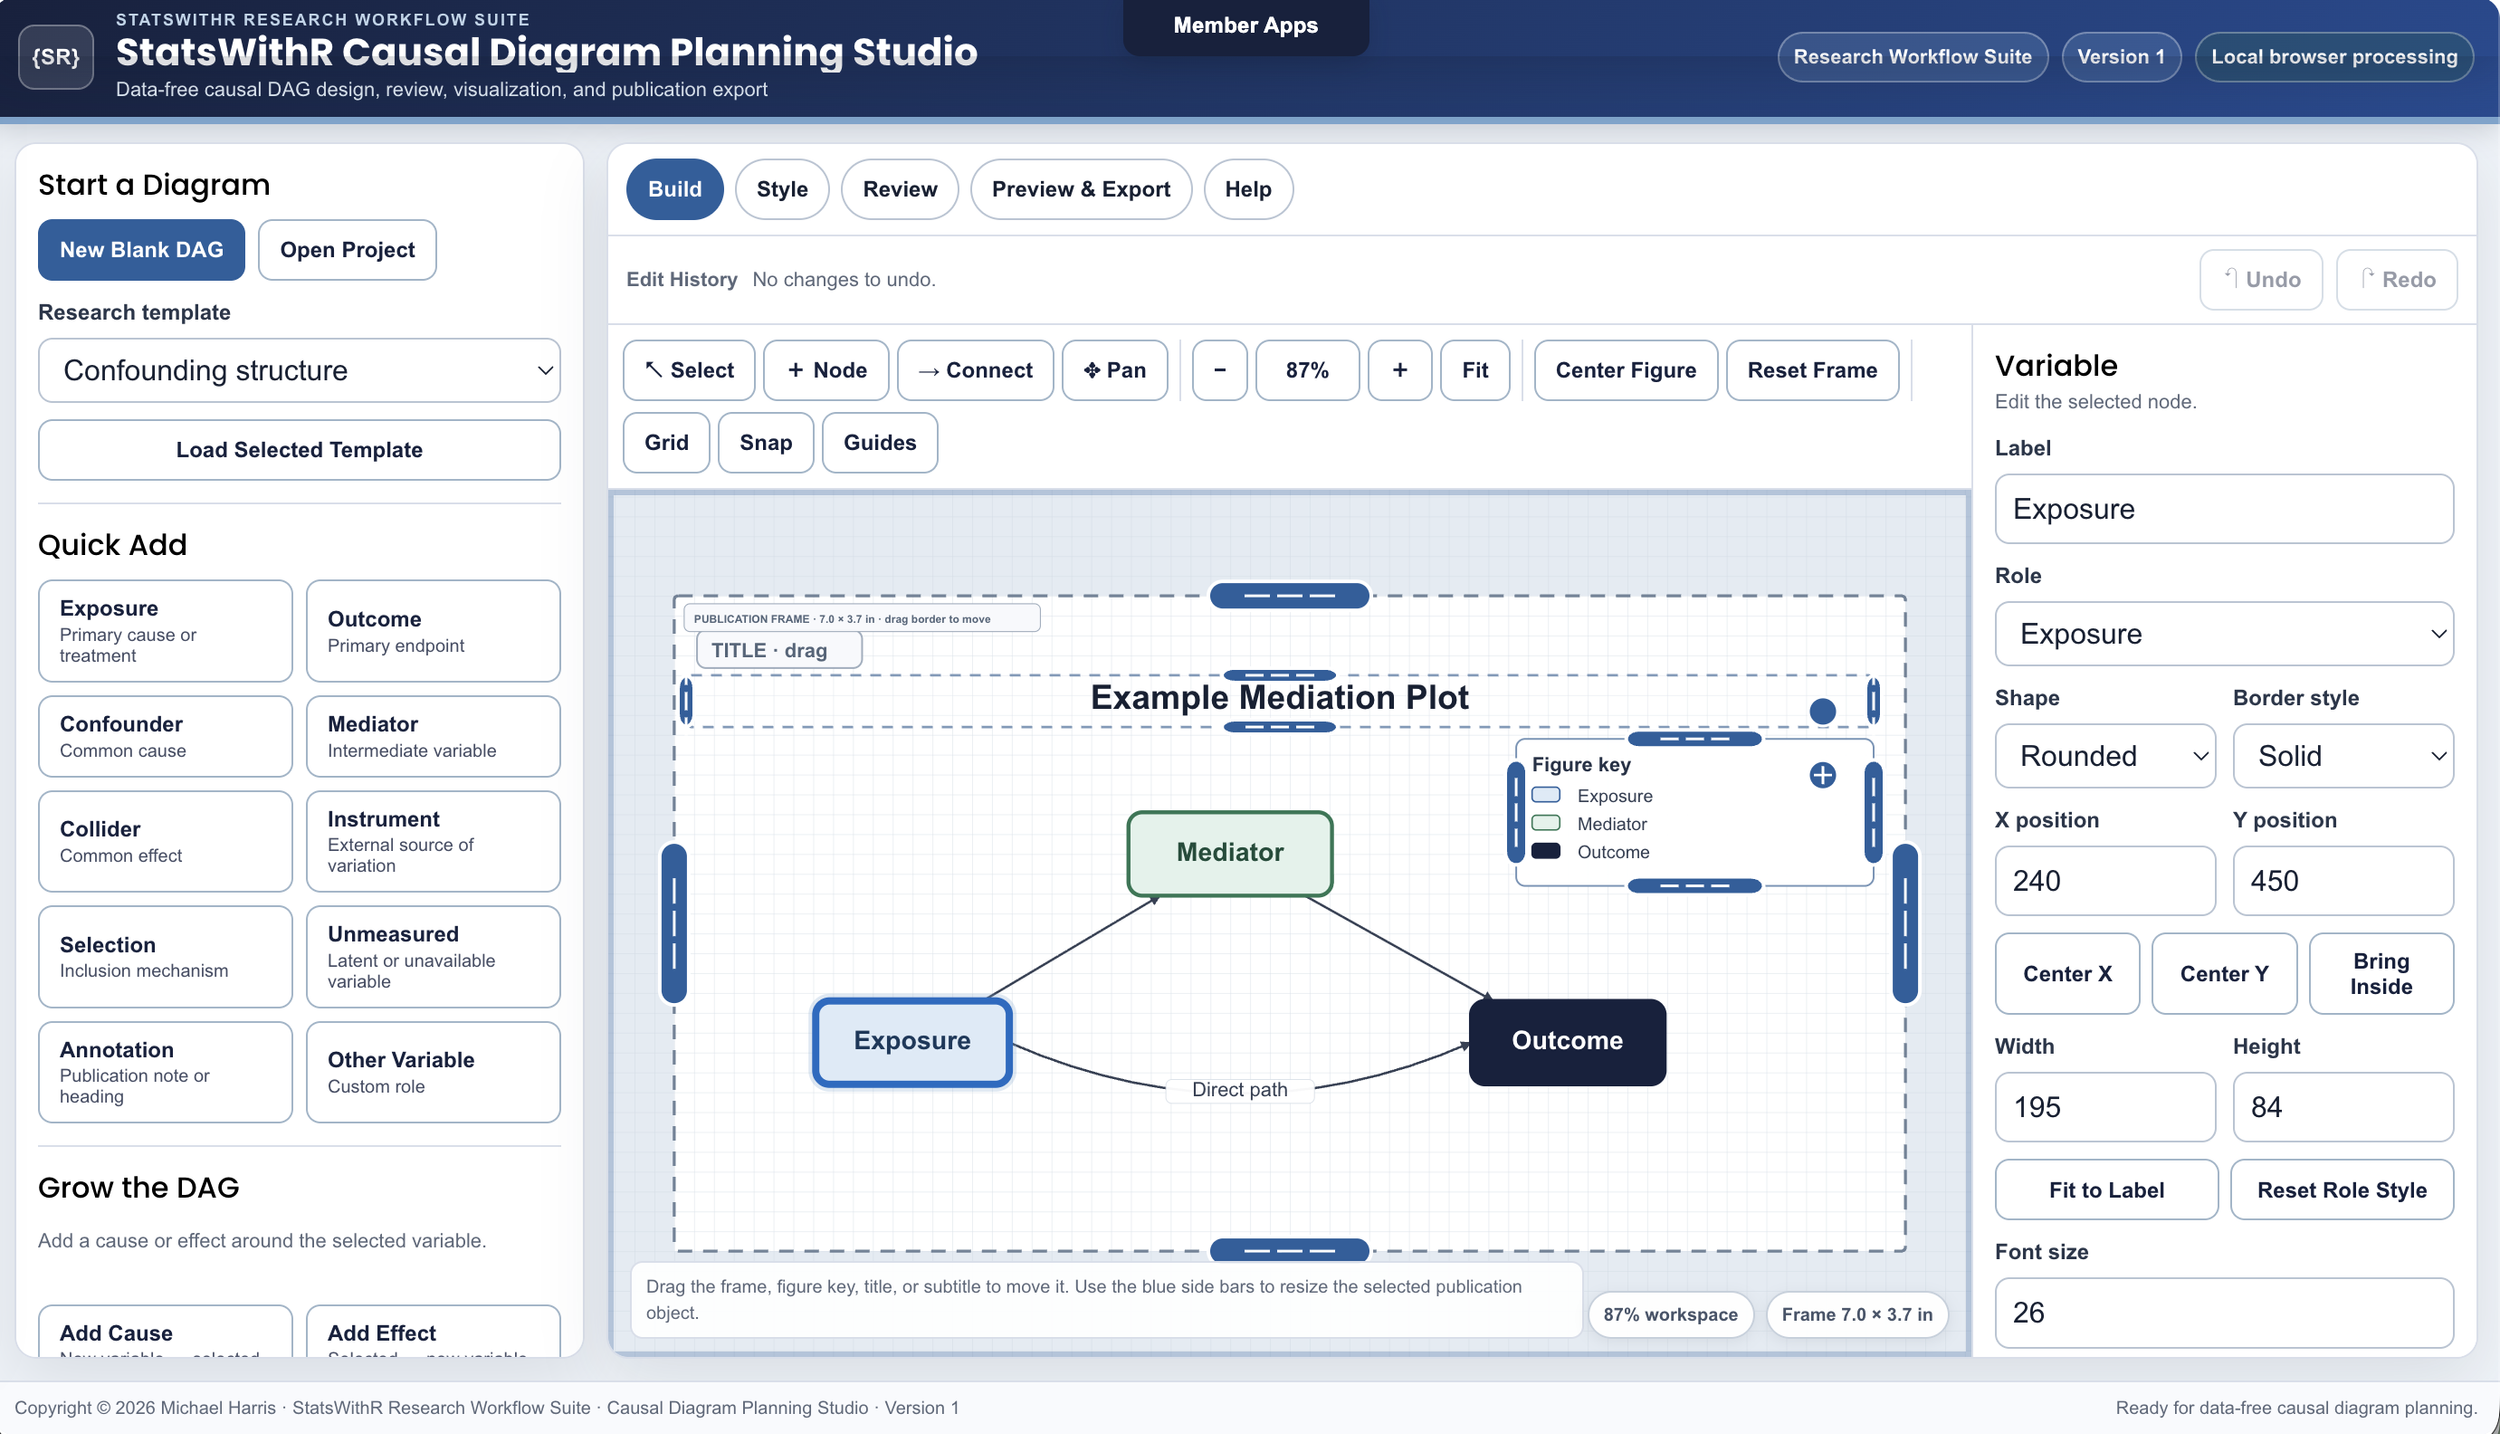
Start with a blank workspace or a research template. Add exposures, outcomes, confounders, mediators, colliders, instruments, selection variables, unmeasured variables, annotations, and other concepts. Connect variables with directed arrows, move them freely, document assumptions, and preserve alternative ideas in the same project while deciding what belongs in the final figure.
The Build workspace is designed for direct figure composition. Drag and resize the publication frame, figure key, title, and subtitle alongside the variables themselves. Adjust node shapes, dimensions, labels, colors, line styles, arrow curvature, and notes while using the optional grid, snapping, alignment guides, keyboard movement, undo, and redo for precise editing.
Preview the completed figure before download, then export an editable SVG for vector-based manuscript workflows or a PNG at 150, 300, or 600 DPI. The application reports the intended print size and exact pixel dimensions so that raster output can be prepared more deliberately for manuscripts, reports, presentations, posters, and teaching materials.
Diagram projects are created and processed locally in the browser, with optional browser autosave and a portable project file for continued work. The application supports visual planning and figure production while leaving the scientific assumptions and causal interpretation under the user’s control.
Included Features
Blank projects and seven research-oriented starting templates
Ten variable roles, including exposure, outcome, confounder, mediator, collider, instrument, selection variable, unmeasured variable, annotation, and other variable
Drag-and-drop variable placement and two-click directed-arrow creation
Directly movable and resizable publication frame, figure key, title, and subtitle
Editable SVG and publication-sized PNG downloads
Undo, redo, keyboard movement, local browser autosave, and portable project saving
The StatsWithR Statistical Software Membership provides access to browser-based applications for REDCap dictionary review, research-data quality management, causal-diagram planning, publication-figure creation, and publication-table preparation. Membership includes all current paid applications, newly released paid applications, and ongoing software improvements while access remains active.
Causal Diagram Planning Studio supports professional causal planning and figure preparation but does not discover causal relationships, identify omitted variables, establish temporal order, determine bias, select a definitive adjustment set, or replace subject-matter, study-design, epidemiologic, or statistical judgment. Users remain responsible for the assumptions represented and for confirming that the final diagram is appropriate for the research question, target estimand, analysis plan, and publication context.